The Rise in Data Generation and the Development of a Center for Global Data Visualization (CGDV)
By Reema Rustagi
Looking back at the last decade, the advent of the internet and use of devices such as tablets, smartphones, and mobile phone applications have generated an astonishing amount of information which is shared electronically and stored digitally; with both data generation and data collection increasing manifold. With over 23 billion connected devices in 2018, we live in an increasingly interconnected world. According to estimates, there will be more data generated in 2019 alone than has ever been generated before in the history of humankind.
For those of us working in the field of international development, we have experienced the same phenomenon as development data increasingly goes digital. But how do we use all this information to drive better processes, better programming and better decision-making for government, business, and consumers? The transformation of data into easily understood data visualizations provides a solution to the challenge faced by many organizations working in international development.
“The transformation of data into easily understood data visualizations provides a solution to the challenge faced by many organizations working in international development
At QED Group, we are creating a virtual center: a data visualization platform that makes it easy to interpret, visualize, discover and share meaningful insights and analysis of credible, publicly available development data while also building local data visualization capacity and a culture of data use.
The Center for Global Data Visualization (CGDV)
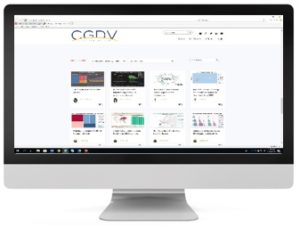
The CGDV is as an initiative that connects universities, private sector and other stakeholders around the world to uncover hidden stories in data that maximize effectiveness in international development. Working with key collaborating institutions like Georgetown University Department of Analytics, George Washington University Department of Data Science, Boston University School of Public Health, Delhi University Hansraj College, and Addis Ababa University, QED is working to establish a global network of like-minded experts and students interested in expanding data visualization to answer some of developments greatest challenges.
We want to engage a new generation of talent in social sciences, increasing local capacity to advance data analytics through visualization. Students can register as part of the CGDV and gain access to training in data visualization, create a profile to post their visualizations and participate in challenges and competitions to promote their work.
All visuals are created by students and interns with guidance from QED’s Innovation and Datahub team to address development areas such as – global health, WASH, education, poverty, literacy, gender, by using open data from credible sites. Students can use any visualization software of their choice to create insightful visuals. Before uploading them on the site, visualizations are reviewed as per the standard guidelines put in place by CGDV.
We want to make things fun so we’ll be incorporating games and challenges to further promote participation. One example of this is a Data Viz Hack-a-thon we co-hosted with George Washington University’s Data Science Program and Georgetown University’s Analytics Program on ‘Increasing Access to Safe Drinking Water in Ethiopia’. Students formed teams of up to 4 members and created data visualizations based on data provided. They were free to use the tech stack of their choosing. Winners then were selected based on quality of visuals, utilization of data and insights presented by the students and awards given. CGDV to launch in Spring 2019. Be watching @QEDGroup for updates!
Reema Rustagi is Senior Data Scientist with QED Group LLC working on predictive modelling, machine learning and artificial intelligence using various analytical tools and techniques. Originally trained as an economist, she has provided data analytics support for USAID-funded monitoring, evaluation and learning projects in multiple countries including Afghanistan, Egypt, West-Bank Gaza, Uganda, and the Ukraine.
LinkedIn profile: https://in.linkedin.com/in/reemarustagi